JavaMelody : monitoring of JavaEE applications
The goal of JavaMelody is to monitor Java or Java EE applications in QA and production environments. It is not a tool to simulate requests from users, it is a tool to measure and calculate statistics on real operation of an application depending on the usage of the application by users.
JavaMelody is opensource (ASL) and production ready: in production in an application of 25 person years. JavaMelody is easy to integrate in most applications and is lightweight (no profiling and no database).
JavaMelody is mainly based on statistics of requests and on evolution charts.
It allows to improve applications in QA and production and helps to:
- give facts about the average response times and number of executions
- make decisions when trends are bad, before problems become too serious
- optimize based on the more limiting response times
- find the root causes of response times
- verify the real improvement after optimizations
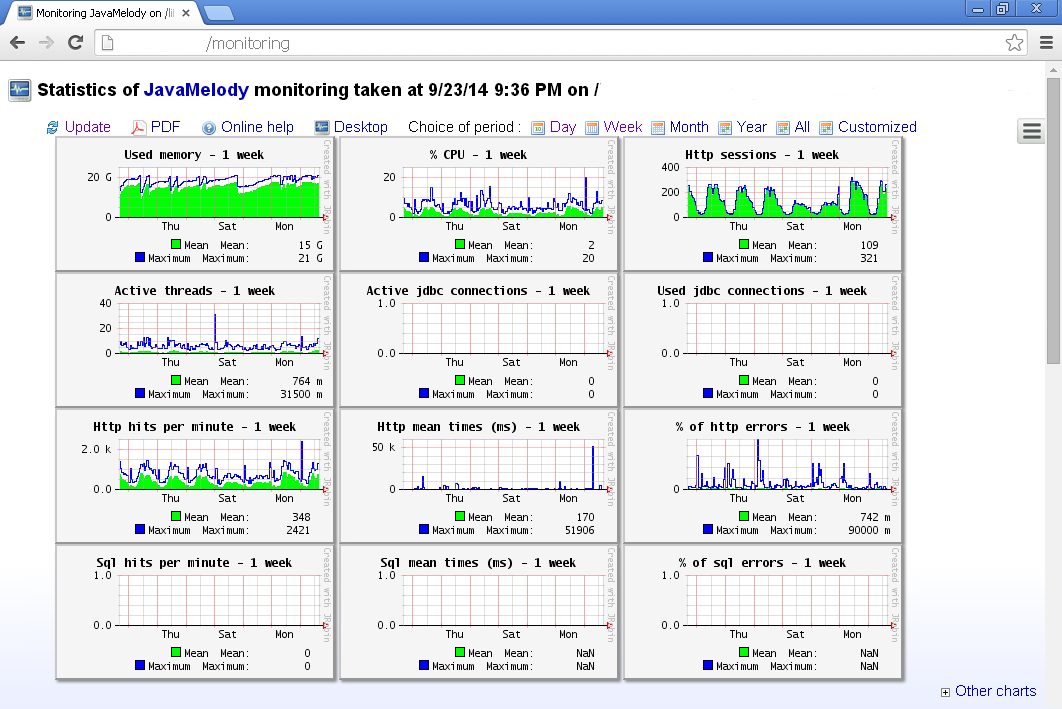
It includes summary charts showing the evolution over time of the following indicators:
- Number of executions, mean execution times and percentage of errors of http requests, sql requests, jsf actions, struts actions, jsp pages or methods of business façades (if EJB3, Spring or Guice)
- Java memory
- Java CPU
- Number of user sessions
- Number of jdbc connections
These charts can be viewed on the current day, week, month, year or custom period.
JavaMelody includes statistics of predefined counters (currently http requests, sql requests, jsf actions, struts actions, jsp pages and methods of business façades if EJB3, Spring or Guice) with, for each counter :
- A summary indicating the overall number of executions, the average execution time, the cpu time and the percentage of errors.
- And the percentage of time spent in the requests for which the average time exceeds a configurable threshold.
- And the complete list of requests, aggregated without dynamic parameters with, for each, the number of executions, the mean execution time, the mean cpu time, the percentage of errors and an evolution chart of execution time over time.
- Furthermore, each http request indicates the size of the flow response, the mean number of sql executions and the mean sql time.
It also includes statistics on http errors, on warnings and errors in logs, on data caches if ehcache and on batch jobs if quartz.
An optional and independent collect server may be used if necessary to unload the application of storage management, and of report generation and to centralize the data of clustered applications or of several applications.
See the online demo.
Read the User’s guide to install JavaMelody.
JavaMelody users’ group is at http://groups.google.com/group/javamelody (email: javamelody@googlegroups.com).
There are a Jenkins plugin and a JIRA/Confluence/Bamboo/Bitbucket plugin and other plugins.
Roots conference slides and video by David Karlsen